Get in Touch Performance marketing · Amman, Jordan
Talk to an expert
Case study · Instagram · Jordan

Instagram Account Management for a Portfolio of Jordanian Brands: 3.64% Engagement in 90 Days

How a “From Reach to Results” management framework moved a multi-industry portfolio of Jordanian brands off follower counts and onto engagement: 53,557,599 views, 3,020,618 accounts reached and a 3.64% engagement rate in 90 days.

Multi-industry portfolioJordanInstagram (Meta)90-day period
Replay availableCase file · 90 days

53,557,599 views

video and post views across the portfolio in 90 days

3,020,618accounts reached
109,900content interactions, Jan–Jul 2025
3.64%avg engagement rate
Watch the campaign replay6 stops, from the starting point to the result
Results at a glance

Results at a glance

AlGurus took over Instagram account management for a multi-industry portfolio of Jordanian brands and ran a 90-day “From Reach to Results” program. In the 90 days from 23 April to 21 July 2025, the four accounts earned 53,557,599 video and post views and reached 3,020,618 unique accounts, and from January to late July 2025 they drew 109,900 content interactions. Paid promotion carried much of the reach: between 42.4% and 89.7% of each account’s views came from ads. The average engagement rate was 3.64%, against a 0.96% industry average for Jordan.

From the dashboardInstagram Insights
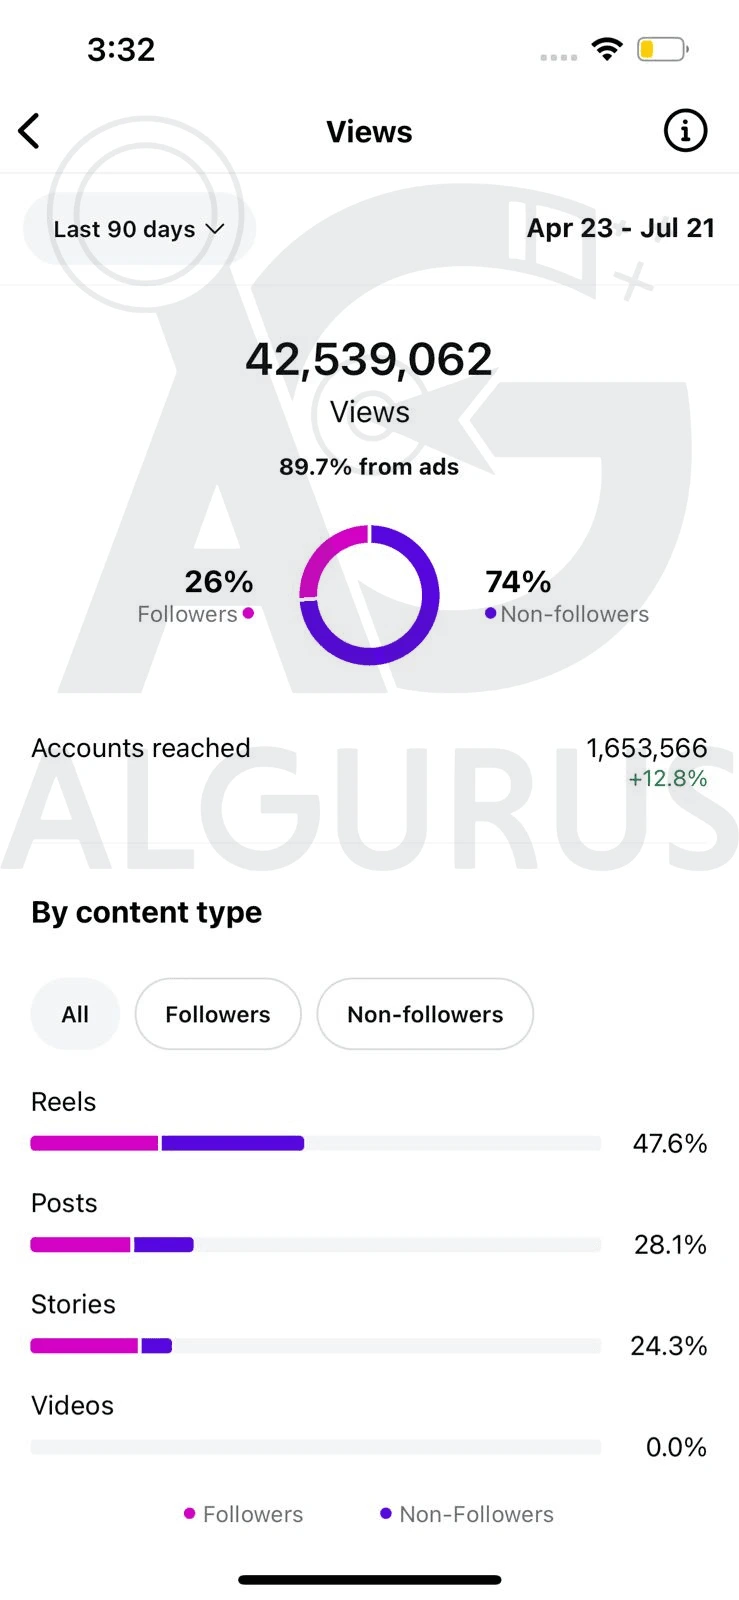
Instagram Insights for one managed account, 23 April to 21 July: 42,539,062 views and 1,653,566 accounts reached in the last 90 days.
Account 1 · Views, last 90 days See all 8 screenshots
Average engagement rate
3.64%vs 0.96% Jordan industry average
Video and post views
53,557,59990-day period
Unique accounts reached
3,020,618across the portfolio
Content interactions
109,900January to late July 2025
Period
90 daysperformance period
Portfolio
Multi-industryJordanian brands
01 · The challenge

Accounts that posted every day and went nowhere

This case covers a multi-industry portfolio of Jordanian brands whose Instagram accounts AlGurus took over. Each brand was different, but the problem was the same: plenty of activity, very little to show for it. The objective was to move each account from basic reach to measurable engagement and business results.

Performance plateau

The accounts were stuck in a cycle of posting without a clear strategy or any conversion path.

Metric misalignment

Success was judged by followers rather than by engagement, leads and sales.

Content inconsistency

No cohesive brand narrative and no data behind the content calendar.

A fourth challenge ran through all of them: localisation. Global Instagram playbooks do not transfer directly to Jordan. What gets attention here depends on local values, humour, trends and cultural moments, and the timing of a post matters as much as the post itself.

02 · The strategy

The “From Reach to Results” management framework

ObjectiveTransform each account’s presence from basic reach to measurable engagement and business results, within a 90-day performance period.

Pillar 1

Results-oriented architecture

Engagement rate and conversion actions (profile visits, website clicks, DMs) replace follower count. A content matrix and written brand guidelines for each account.

Pillar 2

Data-driven optimisation

Audience analysis per account, structured A/B tests on headlines, CTAs and formats, and Reels, Stories and Guides chosen by performance data.

Pillar 3

Community conversion funnel

Interactive Story campaigns with clear calls to action, a DM response protocol for leads, and micro-influencer partnerships in Jordan.

The first change was not creative at all. We changed what the accounts were measured on. Followers stopped being the headline number; engagement rate and conversion actions such as profile visits, website clicks and direct messages took its place. Once that was clear, every content decision could be judged against it.

Next came structure. Each brand got its own content matrix that balanced educational, promotional and community-building posts, plus visual guidelines and a tone-of-voice document so that every post looked and sounded like the same brand, whoever produced it.

Then the data took over. We analysed each account’s audience to find when its followers in Jordan were most active and which content they preferred, and ran structured A/B tests on headlines, calls to action and creative formats. Reels, Stories and Guides were used because the numbers said they worked for that account, not because they were trending.

Finally, we built the path from attention to action. Interactive Story campaigns invited followers to take the next step, a DM response protocol made sure inquiries became leads instead of unread messages, and partnerships with micro-influencers in Jordan added authentic, local credibility.


03 · Execution, replayed

Press play: 90 days in six stops

Drag the timeline or press play. Each stop shows what we did and the number it moved, and the results board fills as you go.

Day 0 · Starting point

Posting without a plan

The accounts were stuck in a cycle of posting with no clear strategy or conversion path. Success was measured in followers, the brand story changed from post to post, and global playbooks were applied without adapting them to Jordan.

  • Performance plateau across the accounts
  • Focus on vanity metrics like followers
  • Inconsistent brand narrative and content planning
  • Global best practices not localised for Jordan
The bar to beat

0.96%

industry average engagement rate in Jordan

Jordan avg0.96%
Step 1 · Architecture

New scoreboard, new structure

We changed what each account was measured on: engagement rate and conversion actions such as profile visits, website clicks and DMs. Each brand got its own content matrix and written visual and tone-of-voice guidelines.

  • Engagement rate and conversion actions replace follower count
  • A content matrix per brand: educational, promotional, community
  • Brand-specific visual guidelines and tone-of-voice documents
Step 2 · Data

Content decided by data, not trends

We analysed each account’s audience to find its peak engagement times and content preferences in Jordan, then ran structured A/B tests on headlines, calls to action and formats. Reels, Stories and Guides were used where the data said they worked.

  • In-depth audience analysis per account
  • A/B tests on headlines, CTAs and creative formats
  • Reels, Stories and Guides chosen by performance data
Metric it moved

53,557,599

video and post views in 90 days

Views53,557,599
Step 3 · Funnel

From follower to conversation

Interactive Story campaigns with clear calls to action moved followers down the funnel, and a DM response protocol made sure every inquiry was answered in a way that could turn it into a lead.

  • Interactive Story campaigns with clear CTAs
  • A strategic DM response protocol for lead conversion
Metric it moved

109,900

content interactions

Interactions109,900
Step 4 · Local credibility

Micro-influencers who sound like Jordan

We built partnerships with micro-influencers in Jordan to bring authentic engagement and local credibility, and to carry each brand to audiences beyond its own followers.

  • Partnerships with Jordanian micro-influencers
  • Content aligned with Jordanian values, humour and cultural moments
Metric it moved

3,020,618

unique accounts reached

Accounts reached3,020,618
Day 90 · Result

Engagement well above the Jordan average

After 90 days the portfolio was measured on engagement, and the engagement was there: an average rate of 3.64% against a 0.96% average for Jordan.

  • 53,557,599 views in 90 days
  • 3,020,618 accounts reached in 90 days
  • 109,900 content interactions, Jan–Jul 2025
Average engagement rate

3.64%

vs a 0.96% industry average for Jordan

Portfolio3.64%
Jordan avg0.96%

The live case reports one 90-day performance period. The stops follow the order of the framework; they are not dated milestones.

Are your Instagram accounts stuck on followers?

A 30-minute Instagram review. We look at your accounts and show you which metrics to chase and what to change first.

04 · The results

From reach to tangible engagement

The engagement comparison below is against the industry average for Jordan quoted in the case, not a before figure for these accounts.

Average engagement rate

Managed accounts vs Jordan industry average

3.64% vs 0.96%

Portfolio totals

Views and reach: 90 days · interactions: Jan–Jul 2025

4 accounts

The views gave the brands massive top-of-funnel awareness across Jordan, and more than three million unique accounts reached means the content travelled well beyond existing followers. But the number that tells the story is the engagement rate: content that people chose to interact with, at a rate well above the Jordan average.

Results vs benchmark (90-day period)
KPIResultWhat it means
Average engagement rate3.64%Above the 0.96% industry average for Jordan
Total video and post views53,557,599Top-of-funnel awareness across Jordan
Total unique accounts reached3,020,618A significant share of the target market
Total content interactions (Jan–Jul 2025)109,900Active engagement, not passive viewing
Platform screenshots

Proof from the platforms

Real screenshots from the ad, analytics and store accounts behind this case. Client names and account details are not shown. Open any screenshot to see it full size.

  • Instagram Insights for one managed account, 23 April to 21 July: 42,539,062 views and 1,653,566 accounts reached in the last 90 days.
    Instagram InsightsAccount 1 · Views, last 90 days
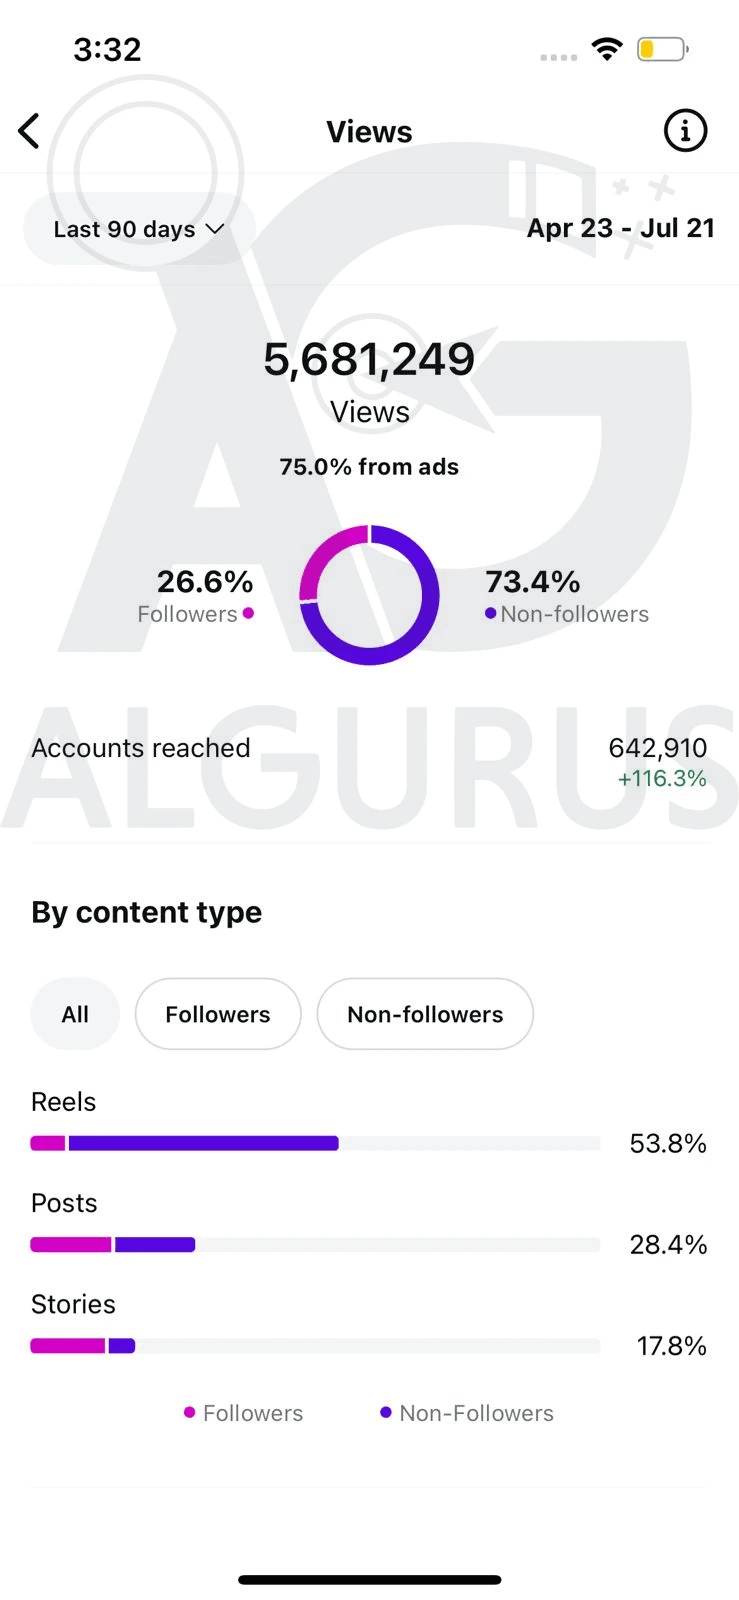
  • Instagram Insights for a second managed account, 23 April to 21 July: 5,681,249 views and 642,910 accounts reached.
    Instagram InsightsAccount 2 · Views, last 90 days
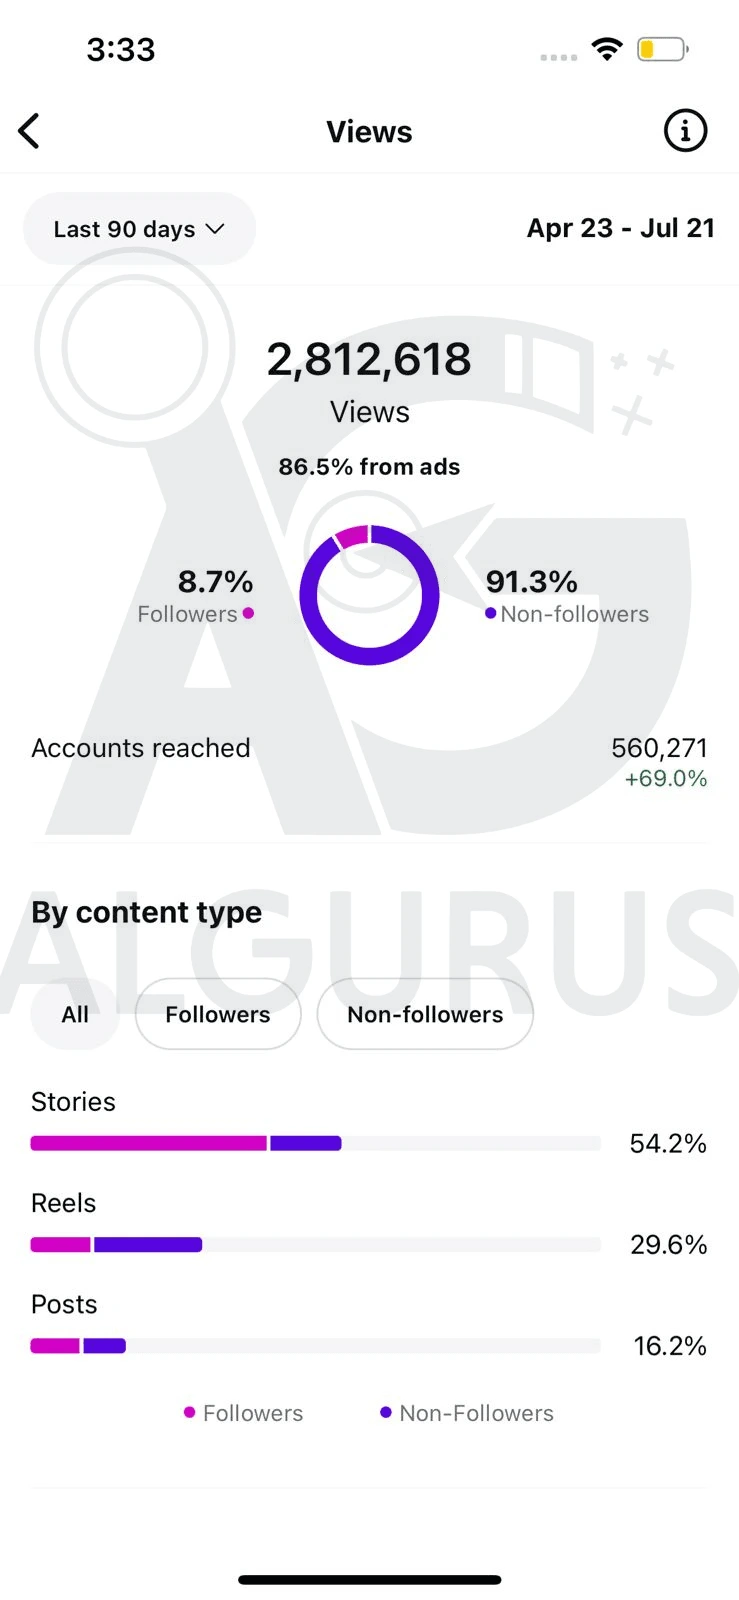
  • Instagram Insights for a third managed account, 23 April to 21 July: 2,812,618 views and 560,271 accounts reached.
    Instagram InsightsAccount 3 · Views, last 90 days
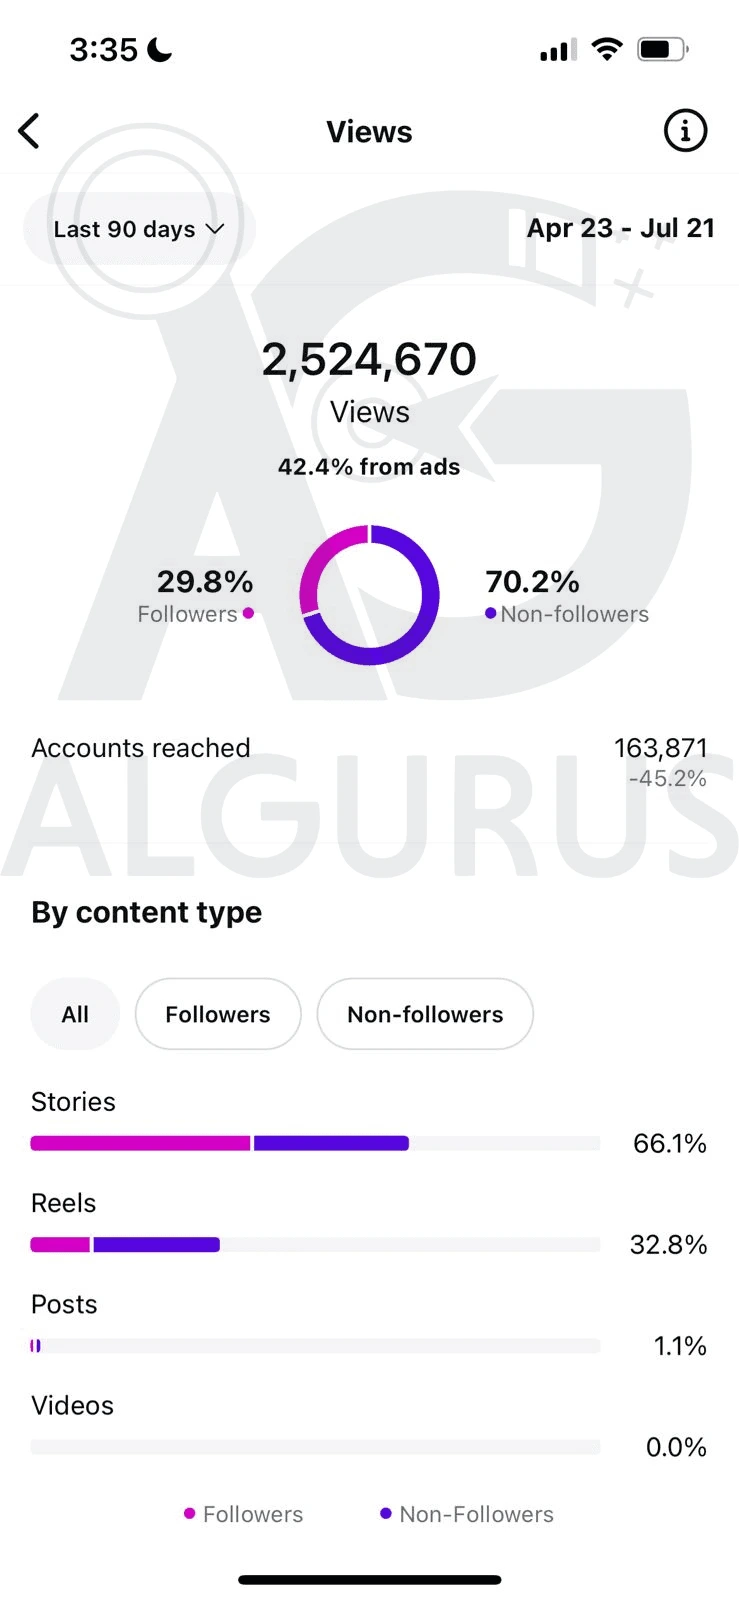
  • Instagram Insights for a fourth managed account, 23 April to 21 July: 2,524,670 views and 163,871 accounts reached.
    Instagram InsightsAccount 4 · Views, last 90 days
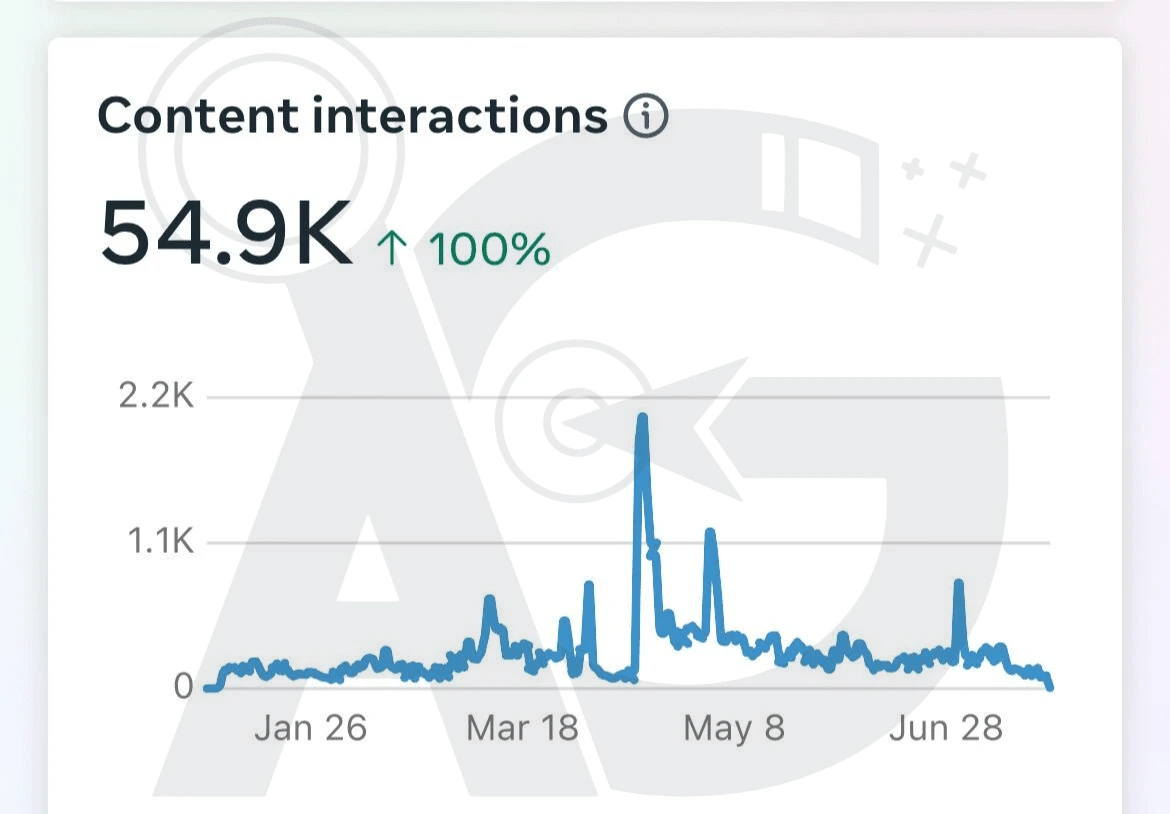
  • Meta Business Suite content interactions chart for one managed account, January to late July 2025: 54.9K interactions.
    Meta Business SuiteAccount content interactions, Jan–Jul 2025
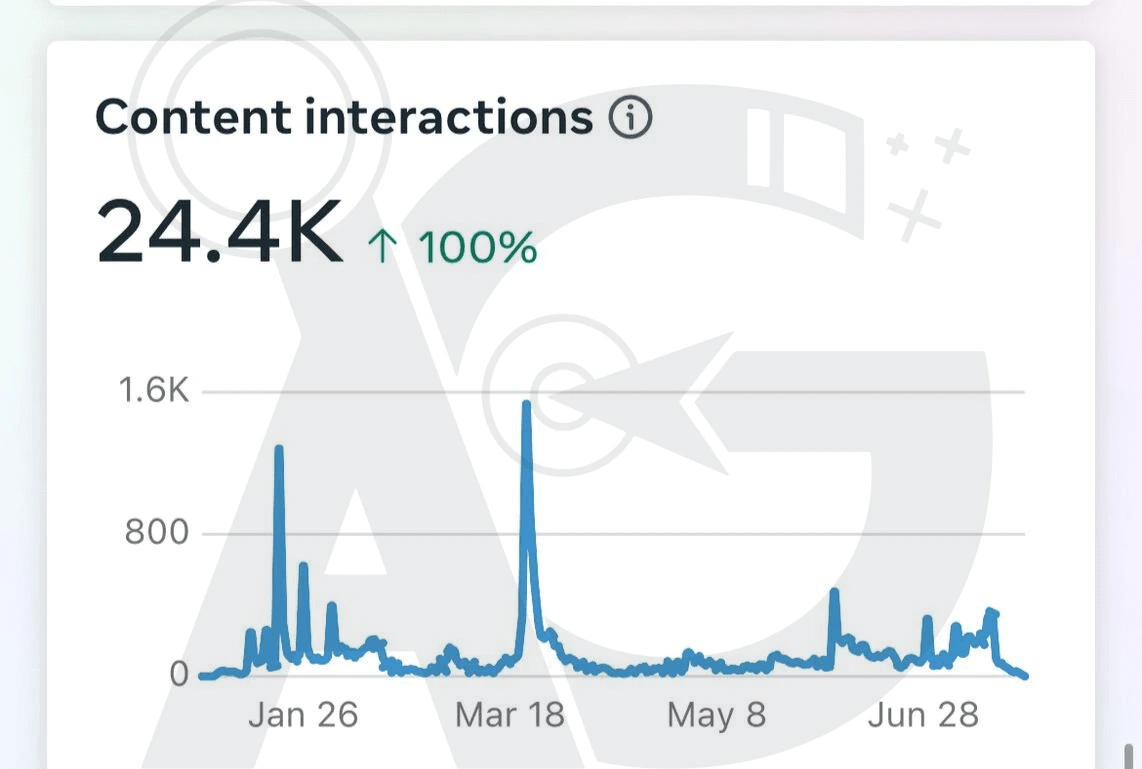
  • Meta Business Suite content interactions chart for a second managed account, January to late July 2025: 24.4K interactions.
    Meta Business SuiteAccount content interactions, Jan–Jul 2025
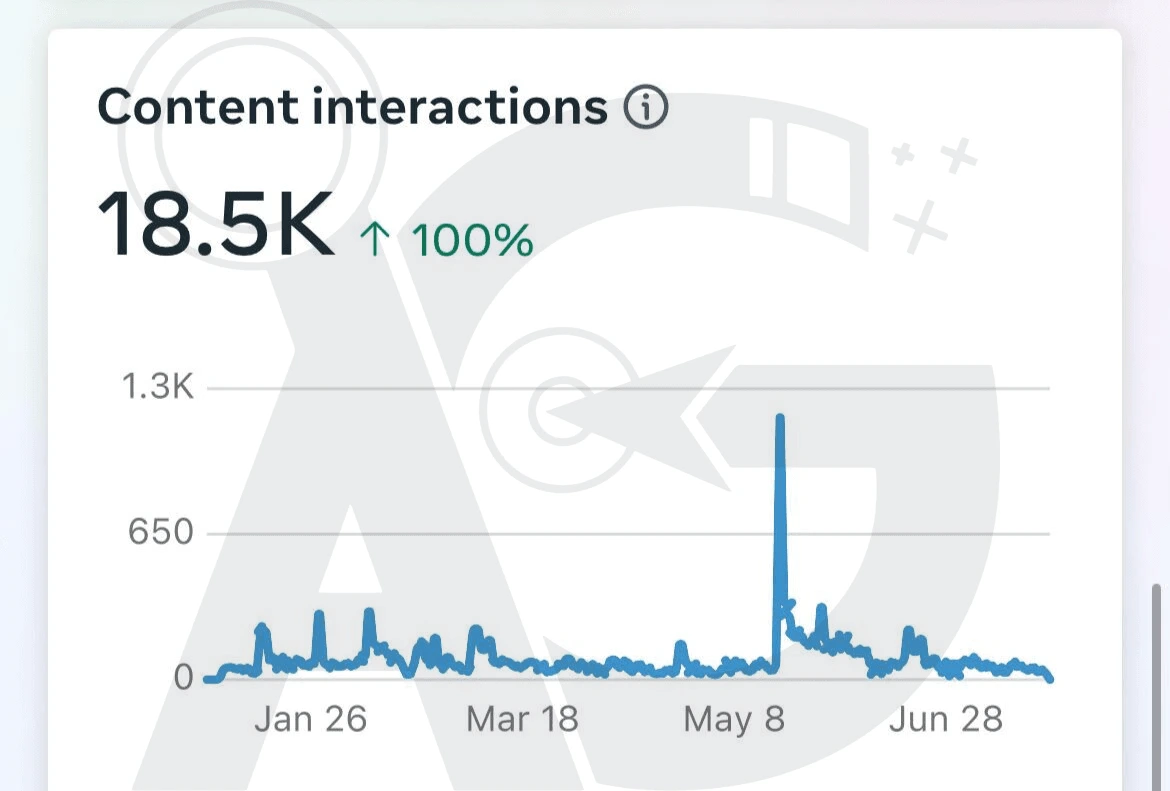
  • Meta Business Suite content interactions chart for a third managed account, January to late July 2025: 18.5K interactions.
    Meta Business SuiteAccount content interactions, Jan–Jul 2025
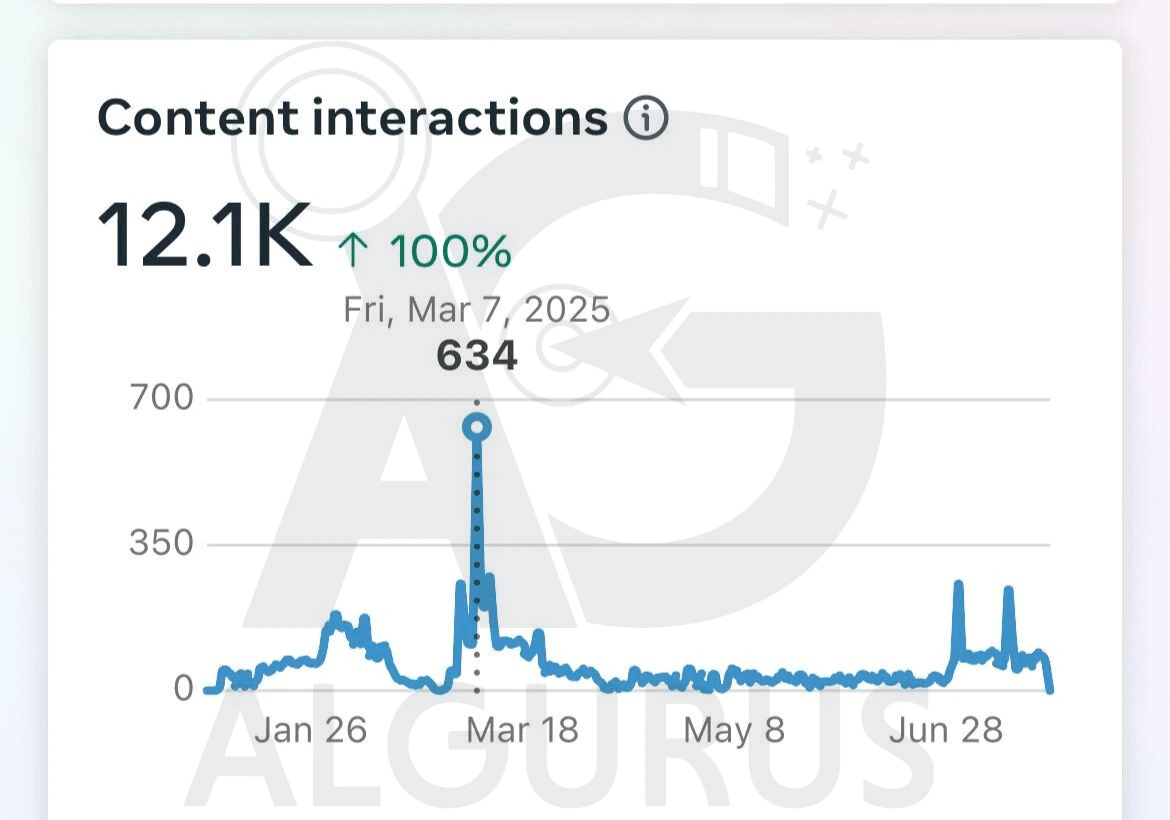
  • Meta Business Suite content interactions chart for a fourth managed account, January to late July 2025: 12.1K interactions, with a peak of 634 on 7 March 2025.
    Meta Business SuiteAccount content interactions, Jan–Jul 2025
05 · What we learned

What we learned managing Instagram accounts in Jordan

Change the scoreboard first

Measuring engagement and conversion actions instead of followers changed every decision that followed.

Data beats trends

Formats, times and hooks chosen by each account’s own data outperformed whatever was trending that week.

Local is not optional

Jordanian values, humour and cultural moments, plus local micro-influencers, made the content feel native.

Why professional management matters for Instagram in Jordan

Algorithm mastery. A local understanding of what drives visibility in the Jordanian market.

Cultural resonance. Content planned around Jordanian values, trends and key cultural moments.

Accountability. A metrics-driven plan instead of a vague posting schedule.

Services used

The team and tools behind this case

Platform & partners
Google PartnerPremier 2026MetaBusiness PartnerShopifySelect PartnerSallaPartner

Built by a Google Premier Partner, Meta Business Partner, Shopify Partner and Salla Partner agency in Amman: $28M+ in ad spend managed, 75+ Shopify stores delivered, 120+ brands served. Google Premier Partner: Top 3% of Google Partners in the World.

Talk to an expert

Talk to the team behind the results

Leave your details. We reply on WhatsApp or by phone between 7 AM and 10 PM Amman time, with a first plan within one working day.

  • We reply from 7 AM to 10 PM, Amman time
  • A first plan within one working day
  • Google Premier Partner, Meta, Shopify and Salla Partner
Prefer WhatsApp? Message us now (opens in a new tab)

Tell us about your accounts (optional)

Tell us about your accounts

Which accounts (optional)Pick all that apply

Posts per month (optional)

With country code, e.g. +962 7X XXX XXXX

Fields marked * are required.

FAQ

Questions about this case

What results did the Instagram management deliver?

In the 90 days from 23 April to 21 July 2025 the four accounts earned 53,557,599 video and post views and reached 3,020,618 unique accounts, with a 3.64% average engagement rate. From January to late July 2025 they drew 109,900 content interactions. Much of the reach was paid: between 42.4% and 89.7% of each account’s views came from ads.

What is a good Instagram engagement rate in Jordan?

The industry average quoted in this case for Jordan is 0.96%. The managed accounts averaged 3.64% over the 90-day period.

What did you change first?

The scoreboard. We stopped measuring success by follower count and moved every account to engagement rate and conversion actions: profile visits, website clicks and DMs. Content planning followed from that.

How do you turn Instagram DMs into leads?

With a strategic DM response protocol, so every inquiry gets a fast, consistent answer with a clear next step, and with interactive Story campaigns that invite people to message in the first place.

Do you work with micro-influencers in Jordan?

Yes. In this program we partnered with micro-influencers in Jordan for authentic engagement and local credibility. It is part of our organic social media marketing service.

Related reading

Guides from the blog on this service

All articles
Get a plan like this

Build my plan

Three taps. We turn your answers into the first steps of your own replay, then walk you through it on a strategy call.

Your business
Your main goal
Your market
Your plan starts with

More sales for a online store in Jordan

  1. Audit tracking first, so every sale is counted in the ad account.
  2. Localise for Jordan: language, offers and the payment or contact methods people there use.
  3. Test 3–5 creatives a month and move budget to what sells.

How would you like to reach us?

Ask AlGurus Assistant AIA first step for your business in 2 minutes Book a strategy callFirst plan within one working day (opens WhatsApp) WhatsApp Call us Contact page