Get in Touch Performance marketing · Amman, Jordan
Talk to an expert

Analytics & Reporting Agency in Jordan

From scattered data to decisions you can trust.

Transform data into profits. We fix your tracking, connect every platform into one bilingual dashboard, and tell you in plain Arabic or English what the numbers mean and what to do next.

Google PartnerPremier 2026 MetaBusiness Partner GA4 + Meta CAPI + server-side Arabic ع + English dashboards
Tracking map· Nawa HomeServer container live
Sources
Online storeShopify, Arabic + English
WhatsApp leadsClick-to-chat, CRM
COD statusDelivered or returned
Server-side GTMFirst-party, consent-aware
  • Deduplicationevent_id
  • Match quality8.9 / 10
  • Events today1,284
Destinations
GA4Ecommerce eventsreceived
Meta CAPIPixel + serverdeduped
Google AdsEnhanced conv.received
Snapchat CAPIConversions APIreceived
DashboardLooker Studioupdated
Fire event
10:42:07 purchase JOD 43.500 · id 8f2a · GA4 ok · CAPI deduped
10:42:31 generate_lead WhatsApp · Meta ok · Google Ads ok
10:43:02 cod_delivered order 1043 · revenue confirmed
Sample tracking map · invented store "Nawa Home"Press an event to send it through

At a glance

AlGurus is an analytics and reporting agency in Amman, Jordan. We audit and rebuild your tracking (Google Tag Manager, Google Analytics 4, Meta Conversions API and server-side tagging), connect your ad platforms, store and CRM into one Arabic and English dashboard in Looker Studio or Power BI, and send a monthly report that explains what happened and what to do next.

The team behind it is a Google Premier Partner and Meta Business Partner with 13+ years of experience and more than $28M+ in ad spend managed for 120+ brands across Jordan, the Gulf and North America.

Experience
13+ yearsIn the market since 2018
Ad spend managed
$28M+Measured and reported
Brands served
120+Across 20+ industries
Google Premier Partner
Top 3%Of Google Partners worldwide
Transform data into profits

Your analytics partner in Jordan.

In Jordan's competitive digital economy, most businesses are not short of data. They are short of answers. Ads Manager says one thing, Google Ads says another, the store dashboard says a third, and the monthly meeting turns into a debate about whose number is right instead of a decision about what to do next.

As an analytics and reporting agency in Jordan, we fix that at the root. First we make the data true: clean tracking, one naming system, events that fire once and only once, and cash on delivery orders counted the way your accountant counts them. Then we make it readable: one dashboard, in Arabic and English, built around the handful of numbers that actually move your business.

Finally, we make it useful. Every month a senior analyst reads the numbers with you, explains what changed and why, and leaves you with a short list of actions. That is the difference between a report you file and a report you use.


As your analytics & reporting agency, we help you

  • Track campaign performanceTrack campaign performance across Google, social media, and e-commerce platforms, with one set of definitions so every channel is judged fairly.
  • Identify hidden opportunitiesIdentify hidden opportunities, such as underperforming products in Amman or untapped MENA markets, before your competitors notice them.
  • Make data-driven decisionsMake data-driven decisions with real-time Arabic and English dashboards that your whole team can read, from the CEO to the media buyer.
What the service includes

Analytics Solutions for Jordanian Businesses

Four problems we hear in almost every first call, and the work we do to solve each one. Take one area, or all four as a complete measurement setup.

01 / 04

Campaign Performance Tracking

Problem

"You're spending on ads but don't know what's working in Jordan."

Solution

We track ROI for Google Ads, Facebook and TikTok campaigns, plus Instagram and Snapchat, so you see revenue and cost per result for every campaign, not just clicks and reach.

  • Conversion setup per platform
  • UTM naming system
  • Meta Conversions API
  • Google Ads enhanced conversions
  • ROAS by campaign
02 / 04

Custom Business Dashboards

Problem

"Scattered data from 10+ tools? You need a unified view."

Solution

We build dashboards in Looker Studio (formerly Google Data Studio) or Power BI for the metrics that matter, like sales in Jordan, MENA traffic and customer demographics, all in one place.

  • Looker Studio
  • Power BI
  • Ads + GA4 + store + CRM connectors
  • Views by role
  • Arabic / English
03 / 04

Social Media Pages Analytics

Problem

"Your Instagram posts get likes, but no sales."

Solution

We track engagement-to-conversion paths for platforms like Snapchat and Facebook, so you can see which posts, Reels and stories lead to messages, visits and orders.

  • Instagram and Facebook insights
  • Snapchat and TikTok
  • Link and WhatsApp click tracking
  • Content performance by format
04 / 04

E-commerce Analytics

Problem

"Shoppers add products to the cart in your Jordanian online store, then disappear before they pay."

Solution

We analyze user behavior with tools like Hotjar and Google Analytics 4: every step from product view to checkout, where people drop off, and which payment or delivery question stops them.

  • GA4 ecommerce events
  • Hotjar heatmaps and recordings
  • Checkout drop-off analysis
  • COD confirmed revenue
  • Product and collection reports
From the blog

Related guides

All articles
Step one: make the data true

Before any dashboard, a tracking health check.

A beautiful dashboard on broken tracking is worse than no dashboard at all, because it makes wrong numbers look official. So every engagement starts with an audit of what you already have.

We open your Google Tag Manager container, GA4 property, Meta Events Manager, Google Ads conversions and store settings, and we test them the way a customer would: browse, add to cart, check out, pay by card, choose cash on delivery, send a WhatsApp message. Every event is checked for whether it fires, fires once, carries the right value and currency, and reaches every platform that needs it.

You receive the findings in plain language, ranked by how much they distort your decisions. Then we fix them.

  • 01Audit and setupWe audit Google Tag Manager and GA4, find the gaps and errors, and fix them.
  • 02A tracking plan for your goalsEvents defined around what matters in Jordan, such as tracking cash on delivery conversions separately.
  • 03Ongoing validationRegular checks so tracking stays accurate after every site change, app install or campaign launch.
54

Tracking health: Nawa Home

11 checks · 3 critical · 2 warnings

Sample audit
Purchase event fires twice on thank-you pageGA4 · Meta
Refreshing the confirmation page sends a second purchase. Reported revenue is inflated and ROAS looks better than it is. Fix: fire once per transaction ID and deduplicate in the server container.
COD orders counted as revenue at checkoutAll platforms
Cash on delivery orders count as sales before the courier collects. Refused and returned orders never leave the reports. Fix: separate "order placed" from "COD delivered" and report confirmed revenue.
Payment gateway shows as a traffic sourceGA4
Buyers return from the bank page as a new session, so the sale is credited to the gateway, not the ad. Fix: referral exclusions and cross-domain settings.
Meta pixel and CAPI not deduplicatedMeta
Browser and server events arrive without a shared event ID, so Meta counts some purchases twice. Fix: pass the same event_id from both sides.
Campaign links use five different UTM stylesNaming
"Instagram", "IG" and "insta" appear as separate sources. Fix: one naming sheet and a link builder for the team.
Google Ads conversion linked to GA4Google
Linked correctly and importing. Kept as is, with enhanced conversions added.
One source of truth

Why your platforms never agree, and how we settle it.

Every ad platform grades its own homework. Meta, Google Ads, Snapchat and GA4 each count conversions with their own rules, so the same month can show four different totals. We reconcile them against your real orders, then report every channel on the same scale.

Purchases reported, same month
Meta Ads212
Google Ads174
GA4129
Store orders156
Delivered (truth)141

Before: four totals, four stories. Meta alone claims more sales than the store received.

Sample data · invented store

  • Different attribution windowsMeta can credit a sale up to days after a view or click. GA4 credits the last channel. Both are "right" by their own rules.
  • View-through and modelled conversionsPlatforms add conversions they estimate rather than observe. Useful for optimisation, misleading in a finance meeting.
  • Duplicates and broken eventsA refreshed thank-you page or a missing event ID can double count real orders.
  • Cash on delivery realityIn Jordan a placed order is not yet revenue. We report delivered, paid revenue next to platform numbers, so budget follows real cash.
  • Cross-platform reconciliationWe align Facebook Ads Manager, Google Ads and GA4 against your store and CRM to give one single source of truth.
Custom business dashboards

One dashboard, two languages, every role.

A sample of the kind of dashboard we build. Switch the role to see how the same data is framed for a CEO, a marketing manager or a finance officer, and switch the language to see the full Arabic version.

N
Nawa Home · Monthly performanceSeptember 2026 · all channels · JOD
Market: Jordan + KSACompare: previous month
Delivered revenue48,320+12.4%
Orders1,184+8.1%
Blended ROAS6.1×+0.7
CAC9.40−6.2%
COD delivery rate87%−2.1 pts
Returning buyers31%+3 pts

Revenue vs ad spend, dailyHover the chart

RevenueAd spend

Revenue by channelJOD

Meta Ads17.9K
Google Ads13.8K
Snapchat6.4K
Organic search5.6K
Direct + WhatsApp4.6K
Sessions61,400
Product views25,170
Add to cart7,380
Checkout2,460
Orders1,184
What this means

Delivered revenue grew 12% on almost the same budget. Growth came from returning buyers, so the next step is a loyalty offer, not more spend.

Sample dashboard · invented brand and numbersBuilt in Looker Studio style
  • Built for your roleReports are customized to your role and goals, whether you are the CEO, the marketing manager or the financial officer. Each person sees the view they need first.
  • Only the KPIs that matterWe highlight the few key performance indicators that drive your business, like customer acquisition cost, lifetime value or ROAS, instead of fifty charts nobody reads.
  • Arabic and EnglishEvery dashboard and report is available in both languages, with proper right-to-left layout, so the whole team reads the same numbers the same way.
The monthly report

Six pages. Read in ten minutes. Acted on all month.

Dashboards show what is happening. The monthly report explains why, and what we should do about it. Here is what lands in your inbox each month, page by page, followed by a review call with your analyst.

NAWA HOMEMonthly report · September 2026Sample

A strong month, carried by returning buyers.

Delivered revenue rose 12.4% on a budget only 3% higher. Two thirds of the growth came from customers who had bought before. COD delivery rate slipped and needs attention.

Revenue48.3K
ROAS6.1×
CAC9.40

Recommendation: launch a WhatsApp re-order offer for past buyers before adding new budget.

Prepared by your AlGurus analystReview call booked
Local market nuances

Numbers read in Jordanian context.

Our local expertise is what sets us apart. We don't just provide generic data; we provide context. A drop in the last week of Ramadan, a spike after salaries land, a payment method your customers trust more than cards: these are not anomalies, they are the market. We read your data with that calendar in mind.

Sample retail demand curve, JordanSample · dates approximate
JFMAMJJASOND
Feb–MarRamadan and Eid al-FitrMayEid al-Adha and Independence DayAugBack to schoolNovWhite FridayMonthlyPayday week
  • Local consumer behavior

    Understanding how Jordanian customers shop online, including payment method preferences such as cash on delivery versus cards, CliQ and wallets.

  • Cultural and seasonal trends

    Interpreting data within the context of Ramadan, Eid, local holidays and Jordanian shopping seasons, so a seasonal dip is not mistaken for a failing campaign.

  • Regional competitors

    Benchmarking your performance against local market competitors, not just global standards that were never written for Amman or Riyadh.

  • Platform preferences

    Analyzing performance on the platforms widely used in Jordan, from Facebook, Instagram and WhatsApp to Snapchat and local directories.

Return on investment

How analytics pays for itself.

The service turns data into a profit-generating asset. The return rarely comes from one big discovery. It comes from dozens of small, confident decisions: money moved away from a campaign that only looked good, a checkout fix, a product pushed in the right city.

  • Eliminate wasted ad spend

    Identify underperforming campaigns and channels and reallocate the budget to what actually works in Jordan.

  • Optimize conversion funnels

    Pinpoint where potential Jordanian customers drop off on your website or app, and fix it.

  • Uncover new opportunities

    Reveal untapped customer segments, high-performing products and marketing messages you didn't know were working.

  • Make data-driven decisions

    Move from guessing to knowing, reducing risk and increasing the effectiveness of every business decision you make.

Leak finderSample funnel
Sessions61,400
41% view a product
Product views25,170
29% add to cart
Add to cart7,380
33% start checkout
Checkout2,460
only 48% complete: biggest leak
Orders1,184
87% delivered and paid
Delivered (COD)1,030

Fix found: delivery fee appears only at the last step. Showing it earlier is the first test on next month's action list.

Proof

Campaign results we delivered, measured to the order.

These are results from campaigns we ran and reported for clients after setting up their tracking. Analytics alone does not create them, but none of them would be visible, or repeatable, without clean measurement.

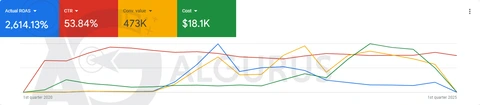
Google Search Ads · luxury jewelry, Jordan26×ROAS

$473K in revenue with a 53% click-through rate.

Industry ROAS benchmark 4–6×
Meta Ads Black Friday · luxury jewelry17.6×ROAS

183 purchases at $3.55 per purchase.

Industry cost per purchase $15–25
Snapchat Ads · watches and jewelry9.98×ROAS

$358K revenue from 1,916 purchases and 230M impressions.

Industry ROAS benchmark 2–4×
Performance Max · watches retailer12.9×ROAS

$8K in revenue from $621 of spend in 18 days.

18 days, tracked to the purchase
Shopify · hardware store, 5 years13.65%returning customer rate

326K JOD in sales and 5,084 orders. Conversion rate 0.38% vs a 0.22% hardware average, average order 76 JOD vs a 55 JOD average.

Growth read from store and GA4 data
Instagram Ads × Salla · honey, KSA3.95×ROAS

640 orders and 76.6K SAR revenue on the same 19K SAR monthly budget.

Same budget, better allocation
Google PartnerPremier 2026Google Premier PartnerTop 3% of Google Partners in the world
MetaBusiness PartnerMeta Business PartnerFacebook, Instagram and WhatsApp
Process

From first call to a report you use.

The same five steps for every client, whether you run one store in Amman or several brands across the Gulf. You get a written timeline after the audit, based on how many platforms we need to connect.

  1. 01

    Discovery call

    Your goals, your channels, the decisions you struggle to make today, and who needs to read the reports.

  2. 02

    Tracking audit

    We test GTM, GA4, pixels, conversions and store data, and give you a ranked list of what is wrong.

  3. 03

    Tracking plan and setup

    Events, naming and server-side tagging built to the plan, then validated end to end with test orders.

  4. 04

    Dashboard build

    Your Arabic and English dashboard, views by role, and KPIs and targets agreed with you.

  5. 05

    Monthly report and review

    The six-page report, a review call, an action list, and ongoing checks that keep the data accurate.

What you get

Everything you receive, in writing.

  • Tracking audit reportEvery issue in your current setup, ranked by impact, with the fix for each.
  • A documented tracking planWhich events we track, what they mean and where they go, so anyone can maintain it later.
  • GA4, GTM and server-side setupIncluding Meta Conversions API, Google Ads enhanced conversions and Snapchat CAPI where you advertise.
  • Cash on delivery tracked properlyPlaced and delivered orders separated, so revenue in reports matches revenue in the bank.
  • Bilingual live dashboardLooker Studio or Power BI, in Arabic and English, with views for each role on your team.
  • Monthly report and review callPlain-language insights and a dated action list, discussed with a senior analyst.
  • UTM and naming systemA shared link builder so every campaign is labelled the same way by everyone.
  • Full ownershipAll accounts, containers and dashboards stay in your name. You keep everything if we part ways.
Talk to an expert

Talk to the team behind the results

Leave your details. We reply on WhatsApp or by phone between 7 AM and 10 PM Amman time, with a first plan within one working day.

  • We reply from 7 AM to 10 PM, Amman time
  • A first plan within one working day
  • Google Premier Partner, Meta, Shopify and Salla Partner
Prefer WhatsApp? Message us now (opens in a new tab)

With country code, e.g. +962 7X XXX XXXX

Fields marked * are required.

FAQ

Everything You Need to Know About Your Analytics & Reporting Agency Service

The questions business owners and marketing managers in Jordan ask us most. Still unsure? Book a call and ask us directly.

Why do we need a specialized analytics agency? We already have Google Analytics.

Having data is not the same as understanding it. While tools like Google Analytics collect information, they often present overwhelming and complex reports. We specialize in translating that raw data into clear, actionable insights tailored for your Jordanian market. We go beyond basic metrics to connect data to your specific business goals, providing context on local consumer behavior, campaign performance and market trends that you can actually use to make smarter decisions and grow your business.

How will you ensure the data you track is accurate and reliable for our business in Jordan?

Data integrity is the foundation of our service. We implement a rigorous process:

  • Audit and setup: we first audit your current tracking setup (like Google Tag Manager and Google Analytics 4) to identify and fix gaps or errors.
  • Customized tracking plan: we define and implement a tracking plan based on your key business objectives and what matters for the Jordanian market, for example tracking cash on delivery conversions separately.
  • Regular data validation: we perform ongoing checks to ensure data collection remains accurate and consistent.
  • Cross-platform reconciliation: we ensure data aligns across platforms (for example Facebook Ads Manager and Google Ads) to provide a single source of truth.
What will the reports look like, and will we actually understand them?

We eliminate complexity and provide clarity. You will receive clean, visually intuitive and easy-to-understand dashboards, not spreadsheets full of confusing numbers. Our reports:

  • Are customized: tailored to your role and goals, whether you're the CEO, marketing manager or financial officer.
  • Focus on KPIs: they highlight only the key performance indicators that matter to your business, like customer acquisition cost, LTV or ROAS.
  • Include plain-language insights: each report comes with a summary of what the data means, why it matters, and clear recommendations for what to do next.
  • Are bilingual: available in both Arabic and English to ensure everyone on your team is aligned.
How does this service provide a return on investment (ROI) for our company?

Our service pays for itself by turning data into a profit-generating asset. We help you:

  • Eliminate wasted ad spend: identify underperforming campaigns and channels to reallocate your budget to what actually works in Jordan.
  • Optimize conversion funnels: pinpoint where potential Jordanian customers are dropping off on your website or app, and fix it.
  • Uncover new opportunities: reveal untapped customer segments, high-performing products or effective marketing messages you didn't know about.
  • Make data-driven decisions: move from guessing to knowing, reducing risk and increasing the effectiveness of every business decision you make.
As a Jordan-based business, how can your analytics account for local market nuances?

Our local expertise is what sets us apart. We don't just provide generic data; we provide context. Our analysis accounts for:

  • Local consumer behavior: understanding how Jordanian customers shop online, including payment method preferences (COD versus digital).
  • Cultural and seasonal trends: interpreting data within the context of Ramadan, Eid, local holidays and Jordanian shopping seasons.
  • Regional competitors: benchmarking your performance against local market competitors, not just global standards.
  • Platform preferences: analyzing performance on platforms widely used in Jordan, from Facebook and Instagram to local directories.

We give you insights that are not just accurate, but also relevant and actionable for the Jordanian market.

Which tools and platforms do you work with?

Google Analytics 4, Google Tag Manager (web and server-side), Google Ads, Meta Events Manager and the Conversions API, Snapchat and TikTok conversion tracking, Google Search Console, Hotjar, and stores on Shopify, Salla, WooCommerce and custom platforms. Dashboards are built in Looker Studio or Power BI, depending on what your team already uses.

Do you offer server-side tracking and the Meta Conversions API?

Yes. Browser tracking alone now misses a share of conversions because of ad blockers, browser privacy rules and iOS settings. We set up server-side tagging and the Meta Conversions API with proper deduplication, so platforms receive more complete and accurate signals and your campaigns can optimize on real sales.

Can you work with our in-house marketing team or another agency?

Yes. Many clients run their own ads or work with another agency and use us as the independent measurement layer. Clean, neutral reporting is often most useful when it is not produced by the same team that spends the budget.

Who owns the tracking setup and dashboards?

You do. We work inside your own Google, Meta and store accounts with access you grant, and every container, property and dashboard stays in your name. If you ever stop working with us, everything keeps running and stays with you.

Strategy call

Stop debating the numbers. Start deciding with them.

Tell us which platforms you use and which decisions feel like guesses today. In one call we will show you what is likely broken in your tracking and what a clear monthly report would look like for your business.

  • Google Premier Partner, top 3% worldwide
  • Meta Business Partner
  • GA4, GTM, server-side and Meta CAPI
  • Arabic and English dashboards
  • A senior analyst you can meet in Amman

How would you like to reach us?

Ask AlGurus Assistant AIA first step for your business in 2 minutes Book a strategy callFirst plan within one working day (opens WhatsApp) WhatsApp Call us Contact page